Silver Price Forecast: XAG breaks below $60, bears eye $55
- Silver breaks below $60.00 this week, confirming a deeper bearish technical damage.
- RSI exits oversold territory, but sellers remain firmly in control.
- Break below $55.63 exposes $54.39 and $50.00 supports.
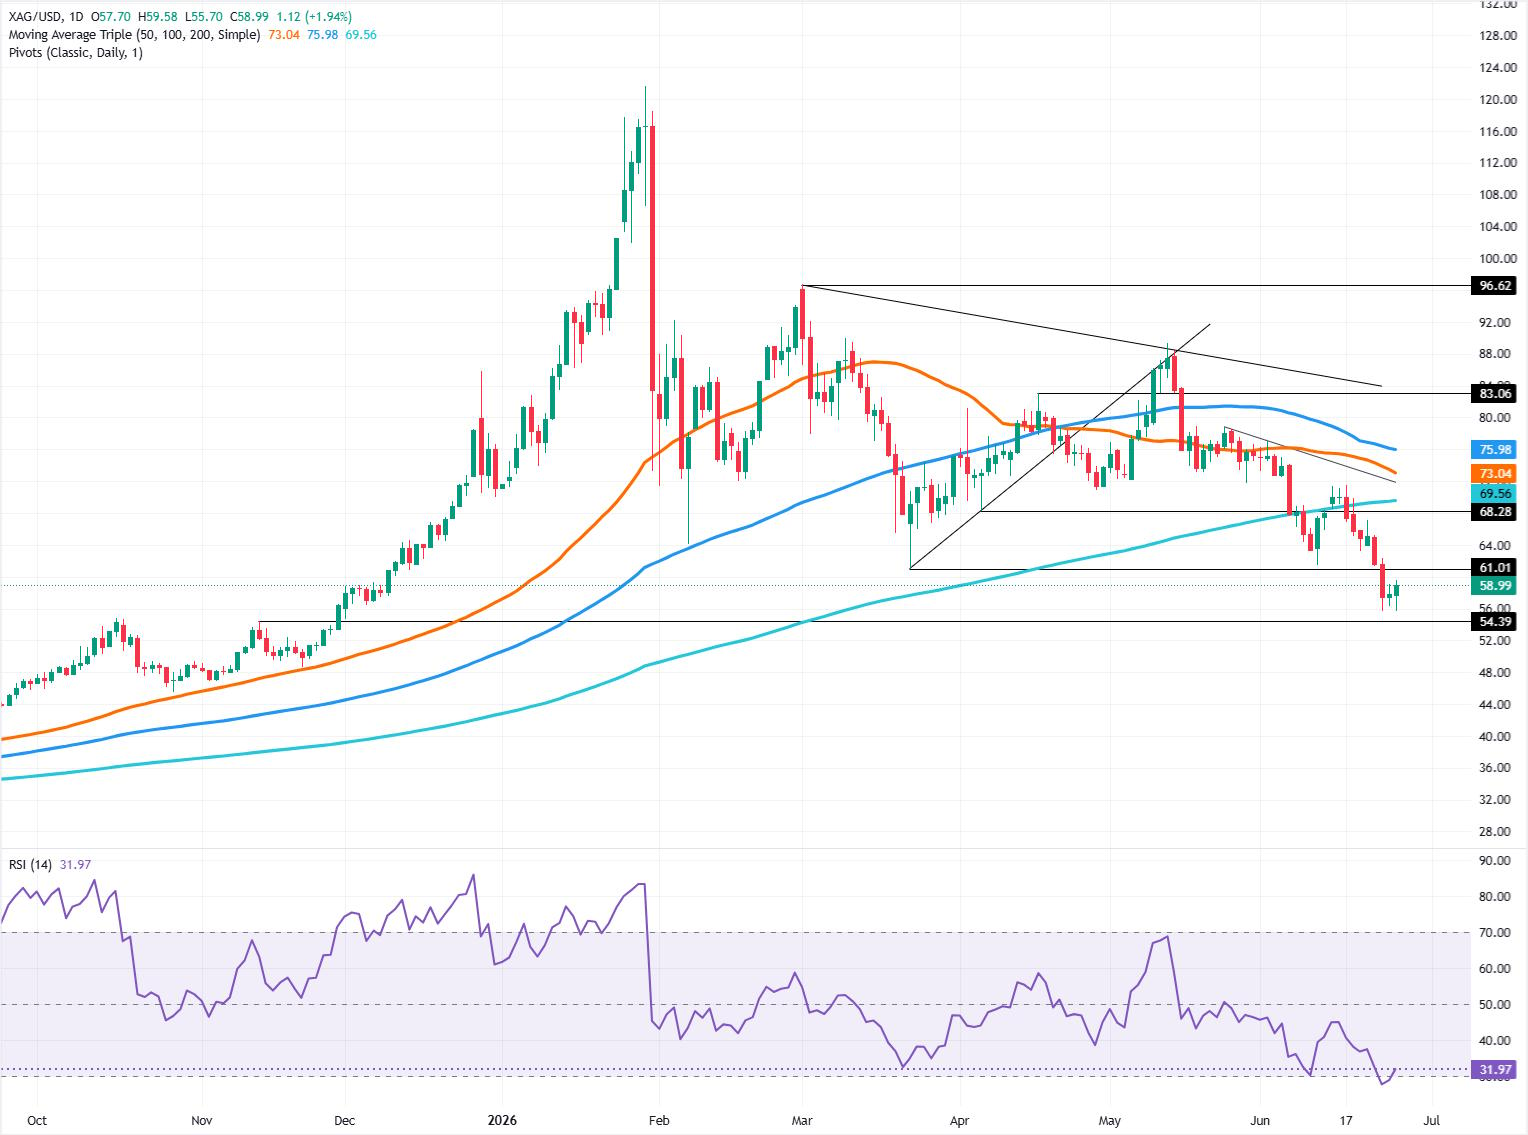
Silver (XAG/USD) price registers gains of nearly 2% on Friday but is poised to finish the week with losses of nearly 10%, as the white metal falls below the $60.00 threshold for the first time since the rally that began at the beginning of December 2025. At the time of writing, the XAG/USD pair trades at $59.00 after hitting a low of $55.70.
XAG/USD Price Forecast: Technical outlook
The white metal has enjoyed quite a reversal and, so far, has fallen nearly 22% in June. After reaching a record high of $121.66 per troy ounce in January, Silver has lost its luster due to several reasons.
The higher-for-longer scenario of interest rates, with major central banks set to hold or hike rates, exerts downward pressure on Silver. Although it’s posting daily gains, XAG is tilted to the downside.
The Relative Strength Index (RSI) shows that sellers are in charge, even though the index has been back above 30 after being overbought for three days.
Given the backdrop, the path of least resistance is downwards. The first support for XAG/USD would be the June 24 swing low of $55.63. Once cleared, the next stop would be the November 13, 2025, cycle high-turned-support at $54.39, ahead of the $50.00 mark.
For a bullish resumption, buyers must clear the $60.00 mark, followed by the 200-day Simple Moving Average (SMA) at $69.56.
XAG/USD Price Chart – Daily
Silver FAQs
Silver is a precious metal highly traded among investors. It has been historically used as a store of value and a medium of exchange. Although less popular than Gold, traders may turn to Silver to diversify their investment portfolio, for its intrinsic value or as a potential hedge during high-inflation periods. Investors can buy physical Silver, in coins or in bars, or trade it through vehicles such as Exchange Traded Funds, which track its price on international markets.
Silver prices can move due to a wide range of factors. Geopolitical instability or fears of a deep recession can make Silver price escalate due to its safe-haven status, although to a lesser extent than Gold's. As a yieldless asset, Silver tends to rise with lower interest rates. Its moves also depend on how the US Dollar (USD) behaves as the asset is priced in dollars (XAG/USD). A strong Dollar tends to keep the price of Silver at bay, whereas a weaker Dollar is likely to propel prices up. Other factors such as investment demand, mining supply – Silver is much more abundant than Gold – and recycling rates can also affect prices.
Silver is widely used in industry, particularly in sectors such as electronics or solar energy, as it has one of the highest electric conductivity of all metals – more than Copper and Gold. A surge in demand can increase prices, while a decline tends to lower them. Dynamics in the US, Chinese and Indian economies can also contribute to price swings: for the US and particularly China, their big industrial sectors use Silver in various processes; in India, consumers’ demand for the precious metal for jewellery also plays a key role in setting prices.
Silver prices tend to follow Gold's moves. When Gold prices rise, Silver typically follows suit, as their status as safe-haven assets is similar. The Gold/Silver ratio, which shows the number of ounces of Silver needed to equal the value of one ounce of Gold, may help to determine the relative valuation between both metals. Some investors may consider a high ratio as an indicator that Silver is undervalued, or Gold is overvalued. On the contrary, a low ratio might suggest that Gold is undervalued relative to Silver.