Gold retreats slightly, holds range as traders weigh Fed outlook and US-Iran talks hopes
- Gold trades with a mild downside bias on Wednesday as the US Dollar stabilizes after recent losses.
- Hopes that US-Iran peace talks could resume this week lift sentiment, but risks remain elevated.
- On the 4-hour chart, XAU/USD continues to trade within a range, with the 200-period SMA acting as a key resistance level.
Gold (XAU/USD) retreats on Wednesday as the US Dollar (USD) shows signs of stabilization after seven consecutive days of losses, while evolving Middle East developments continue to shape broader market sentiment. At the time of writing, XAU/USD is trading around $4,813 after briefly touching a one-month high of $4,871 during the Asian session.
Expectations of renewed negotiations between the United States and Iran have improved after US President Donald Trump said in an interview with Fox Business that “the Iran war can be over very soon.” Reports suggest a second round of peace talks could take place as early as this week, before the current two-week ceasefire expires.
However, the situation remains uncertain. According to a report by The Washington Post, the Pentagon is preparing to deploy thousands of additional troops to the Middle East in the coming days as Washington steps up pressure on Iran to secure a deal.
This keeps market sentiment fragile despite cautious optimism that a diplomatic resolution may still be within reach. At the same time, the US blockade of the Strait of Hormuz remains in place, limiting downside in Crude prices. West Texas Intermediate (WTI) is trading near $90 at the time of writing, snapping a three-day losing streak, after briefly slipping to over three-week lows near $85 earlier in the day.
A US Central Command (CENTCOM) Commander Admiral Brad Cooper said that “US forces have completely halted economic trade going into and out of Iran by sea.” Meanwhile, Iran’s Revolutionary Guards warned they would block imports and exports across the Gulf and the Sea of Oman if the US blockade on Iranian vessels continues.
While Oil prices remain elevated, the pullback from recent highs has eased inflation concerns, reducing pressure on the Federal Reserve (Fed) to tighten monetary policy and reviving interest rate cut expectations, which could support the non-yielding metal.
However, uncertainty around the Fed’s path persists, as markets continue to assess the economic impact of the war in Middle East. This supports expectations that the central bank will keep rates on hold in the coming months, which remains a headwind for Gold and is diminishing its safe-haven appeal despite heightened geopolitical tensions.
Technical analysis: XAU/USD tests 200-period SMA resistance on the 4-hour chart
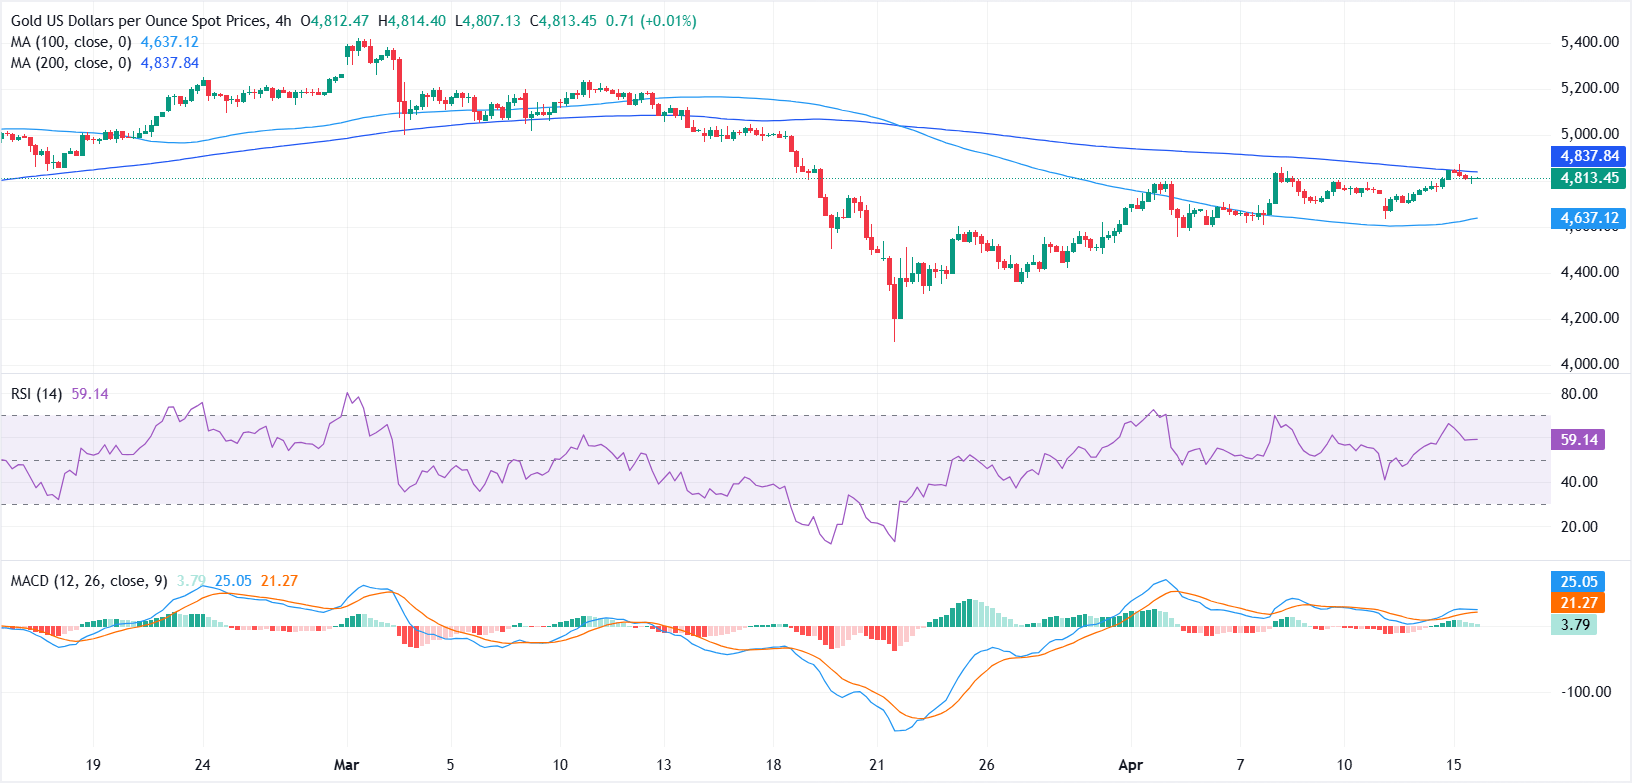
From a technical perspective, the 4-hour chart shows buyers struggling to extend gains above the 200-period Simple Moving Average (SMA) near $4,839, while holding above the 100-period SMA around $4,632, keeping price action largely range-bound with a mild bullish bias.
The Relative Strength Index (14) near 57 reinforces a positive tone without yet signaling overbought conditions, while the Moving Average Convergence Divergence (MACD) indicator remains in positive territory, suggesting upside momentum remains in play even as gains approach the longer-term average overhead.
On the upside, a sustained break above the 200-period SMA could signal a clear breakout from the current range and strengthen buying interest, with gains potentially extending toward the $5,000 mark.
On the downside, the immediate pivot is the current price region around $4,800, with more meaningful dynamic support emerging at the 100-period SMA at $4,632.70, where a deeper pullback could look for buyers to re-enter in line with the prevailing constructive bias.
US Dollar Price Today
The table below shows the percentage change of US Dollar (USD) against listed major currencies today. US Dollar was the strongest against the Swiss Franc.
| USD | EUR | GBP | JPY | CAD | AUD | NZD | CHF | |
|---|---|---|---|---|---|---|---|---|
| USD | 0.14% | 0.13% | 0.21% | 0.07% | -0.22% | 0.11% | 0.22% | |
| EUR | -0.14% | -0.01% | 0.07% | -0.07% | -0.29% | -0.04% | 0.08% | |
| GBP | -0.13% | 0.00% | 0.09% | -0.03% | -0.27% | -0.03% | 0.09% | |
| JPY | -0.21% | -0.07% | -0.09% | -0.14% | -0.37% | -0.14% | -0.01% | |
| CAD | -0.07% | 0.07% | 0.03% | 0.14% | -0.22% | 0.02% | 0.13% | |
| AUD | 0.22% | 0.29% | 0.27% | 0.37% | 0.22% | 0.25% | 0.36% | |
| NZD | -0.11% | 0.04% | 0.03% | 0.14% | -0.02% | -0.25% | 0.11% | |
| CHF | -0.22% | -0.08% | -0.09% | 0.01% | -0.13% | -0.36% | -0.11% |
The heat map shows percentage changes of major currencies against each other. The base currency is picked from the left column, while the quote currency is picked from the top row. For example, if you pick the US Dollar from the left column and move along the horizontal line to the Japanese Yen, the percentage change displayed in the box will represent USD (base)/JPY (quote).